Defensive Ingestion for COVID-19 Data Streams
A real-time COVID-19 forecasting pipeline stalled because external hospital APIs sent messy payloads. The fix was defensive ingestion with Celery workers, strict Pydantic validation, PostgreSQL writes for clean records, a Redis dead letter queue, offline recovery, and source-level freshness monitoring.
The forecasting pipeline stalled for four hours yesterday.
I was building a real-time COVID-19 tracker. Kaggle datasets gave me a clean historical baseline. That part was fine. CSV files, known columns, repeatable structure.
The problem started when I tried to make the system predictive.
I integrated live data feeds from regional hospital APIs. That broke the pipeline almost immediately.
One hospital sent daily case counts as integers. Another sent "N/A" in the same field. A third changed a JSON key from icu_patients to icu_admitted without warning.
The model was not the first thing that failed.
The ingestion layer failed.
The basic shape looked like this:
hospital APIs
→ fetch latest records
→ validate payload
→ write to PostgreSQL
→ forecasting model reads fresh data
→ dashboard updates
The architecture looked clean until external APIs started sending inconsistent payload shapes.
That looked clean on paper.
In production, the payloads were messy. The validation script hit type errors. Automatic retries kicked in. Those retries blocked the main execution thread. The queue backed up. Processing time kept climbing.
The dashboard was still online. The app still loaded. The model endpoint still existed.
But the data was stale.
A real-time dashboard running four hours behind is just a delayed report with a better UI.
The ingestion layer had to assume bad input
The backend lesson was simple:
You cannot force external systems to send clean data.
You have to architect the ingestion layer as if every external API will eventually send garbage.
So I changed the pipeline.
I removed automatic retries from the main ingestion loop and added a dead letter path.
The updated shape became:
hospital API response
→ Celery worker
→ Pydantic validation
→ valid payload writes to PostgreSQL
→ invalid payload goes to dead letter queue
→ worker moves to the next record
Malformed records moved to a Redis dead letter queue instead of blocking the live ingestion path.
The important change was isolation.
A bad record could no longer hold the whole pipeline hostage.
If a hospital sent "N/A" where the system expected an integer, that specific payload was moved into a Redis dead letter queue. The worker did not keep retrying it inside the live path. It logged the failure, preserved the raw payload, and moved on.
The main ingestion path stayed fast:
fetch → validate → write → continueThe recovery path ran separately:
read dead letter queue → inspect malformed payloads → clean recoverable records → backfill PostgreSQL
The live lane stayed fast. The recovery lane handled malformed records without blocking fresh data.
That separation mattered more than the model.
The forecasting model could only be useful if fresh data kept arriving. If the ingestion layer jammed every time an API changed shape, the model was only pretending to be real time.
Strict validation made bad data visible
For validation, I kept the schema strict.
The worker needed to know the difference between bad data and missing data. A missing ICU count was not the same as a string in a numeric field. A renamed key was not the same as a real zero.
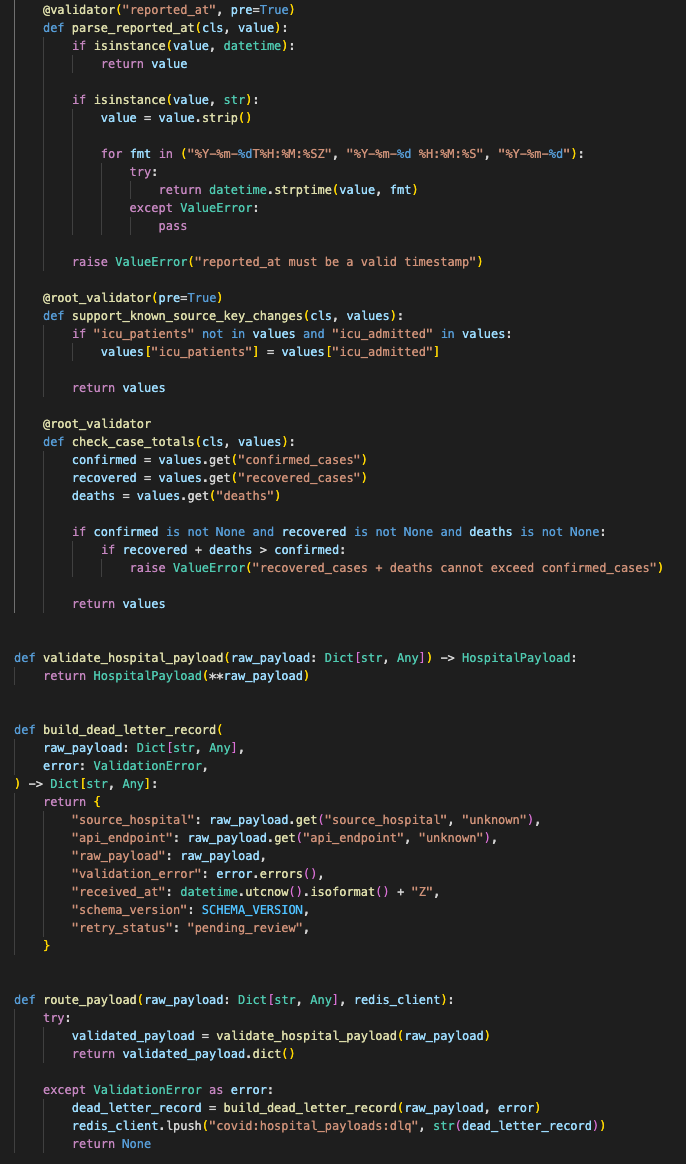
The schema kept bad values out of PostgreSQL and routed malformed records to a recovery path with clear validation errors.
I also stored enough context to debug failures later:
source_hospital
api_endpoint
raw_payload
validation_error
received_at
schema_version
retry_status
Each malformed payload kept enough source, schema, and error context to support batch recovery later.
That made recovery less chaotic.
Instead of hunting through logs, I could inspect failed payloads by source. If one hospital changed icu_patients to icu_admitted, I could write a small mapping fix and recover the affected records in batch.
The live dashboard did not need to wait for that cleanup.
Valid data still reached PostgreSQL immediately. The forecasting model pulled the latest available numbers. The dashboard refreshed in under two seconds again.
The dead letter queue needed monitoring
The edge case I cared about most was silent corruption.
Dropping bad payloads is safer than forcing them into the database, but it creates another risk. If too many records get sent to the dead letter queue, the dashboard can look fresh while missing a major source.
So the dead letter queue also needed monitoring. Not just logs. Actual operational signals:
dead letter count by source
validation error type
percentage of rejected payloads
last successful ingestion time per hospital
freshness of dashboard data
The system could keep running while still showing which data source was degrading.
That made the failure visible.
If one API started sending malformed records, the system could keep running while still telling me which source was degrading. That is the balance I wanted.
The final backend shape became:
external hospital APIs
→ Celery ingestion workers
→ strict schema validation
→ PostgreSQL for clean records
→ Redis dead letter queue for malformed records
→ offline recovery script
→ forecasting model
→ real-time dashboard
→ ingestion health alerts
The final pipeline protected freshness by isolating malformed records, preserving recovery context, and monitoring source-level health.
Result
This was the useful lesson from the build:
Kaggle gives you clean historical files. Production data streams do not.
A predictive system is only as reliable as its ingestion layer. The model can be mathematically sound and still useless if the data path blocks, corrupts records, or accepts bad inputs quietly.
The fix was not glamorous:
- Celery workers
- strict validation
- PostgreSQL writes
- Redis dead letter queue
- offline recovery
- source-level monitoring
- freshness checks
Those pieces kept the dashboard alive when external APIs behaved badly.
The model did not need cleaner assumptions.
The backend needed better failure handling.
First written on May 14, 2020.
Want to implement this architecture in your business?
Discuss Your Project