Energy Intelligence: Turning Live Telemetry Into Server-Side Aggregates
Sentinel treats smart home telemetry as a backend time-series problem first. The database stores raw readings, the server computes verified aggregates, and the AI assistant explains bounded summaries instead of inventing energy math.
I’ve been building Sentinel, a smart home energy monitoring platform around a solar-company use case.
The shape is straightforward: homeowners need an authenticated dashboard where they can see device-level consumption, solar-related readings where available, estimated cost, and ask natural-language questions about what’s happening in the house.
The easy version is a dashboard with charts.
The harder version is making the numbers trustworthy enough that an AI assistant can explain them without inventing the math.
Energy telemetry looks simple until the backend has to answer normal user questions:
- How much energy did I use today?
- Which device used the most power this week?
- Am I importing from the grid or exporting?
- Why is my bill higher than usual?
Those questions are not chat problems first.
They are time-series problems.
The first architecture rule was simple:
The model should not aggregate raw telemetry.
Raw device readings belong in the database. The backend should turn those readings into bounded, verified energy summaries before the AI gets involved.
The backend owns energy math
The main request shape looks like this:
device telemetry
→ authenticated FastAPI API
→ PostgreSQL / TimescaleDB
→ hypertable on timestamp
→ server-side aggregation
→ dashboard charts
→ bounded AI context
→ streamed assistant response
The database stores raw readings, the backend computes bounded aggregates, and the AI assistant explains prepared context.
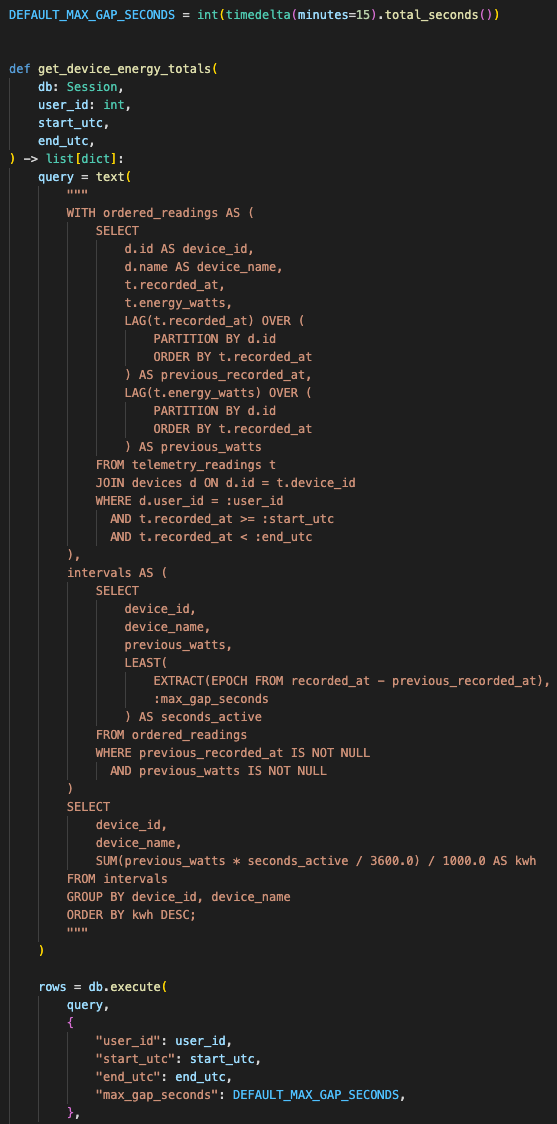
The core telemetry table is small on purpose.
device ID
timestamp
instantaneous watts
That is enough if the backend treats it correctly.
The app stores energy_watts as an instantaneous power reading. To answer energy questions, the backend integrates watts over time into Wh or kWh.
That matters because power and energy are not the same thing.
A device drawing 500W for one minute is different from a device drawing 500W for eight hours. The database path has to account for time gaps between readings, not just average a column and hope the answer looks right.
The telemetry service uses a piecewise-constant integration model.
For each device, it looks at the previous power reading, calculates the time delta to the next reading, and converts that interval into energy:
watts × seconds / 3600 = WhThen it groups the result by bucket.
For per-device totals, it divides Wh by 1000 to return kWh.
The backend integrates instantaneous watts over time instead of asking the model to infer energy from raw telemetry rows.
Telemetry gaps need hard limits
The important edge case is gaps.
Telemetry streams are never perfectly clean. Devices disconnect. Browsers sleep. Demo data gets refreshed. Networks drop packets. If the backend blindly assumes a reading stayed active across a long outage, it can overstate energy badly.
So Sentinel caps large gaps at 15 minutes.
DEFAULT_MAX_GAP_SECONDS = 15 minutesIf a device disappears for hours, the backend does not pretend it consumed continuously for the whole outage.
That is the kind of backend guardrail that makes the dashboard more honest.
Calendar windows follow the user’s timezone
The second rule was calendar alignment.
Users do not think in UTC windows. They ask about “today,” “last 3 days,” and “this week” in their own timezone.
So the telemetry service computes local windows first:
day
→ local midnight to now

3days
→ last 3 full local days, excluding today

week
→ last 7 full local days, excluding today
Then it converts those local boundaries back to UTC for database filtering.
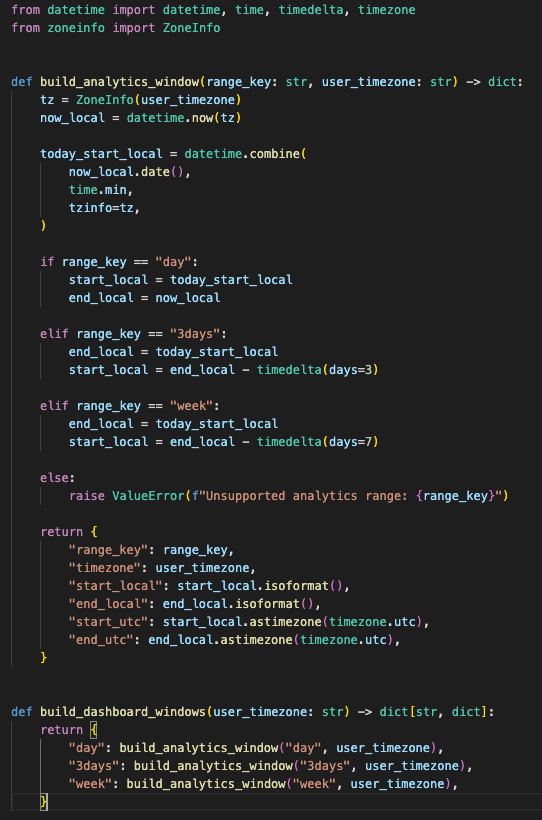
The dashboard and assistant use the same local calendar boundaries before querying UTC timestamps.
The dashboard follows the same boundary.
The frontend detects the user’s timezone and passes it into analytics. That keeps the chart totals and the AI assistant aligned to the same calendar logic.
This prevents a common bug in energy dashboards: the chart says one number, the assistant says another, and both are technically using “today” with different clocks.
TimescaleDB gives the telemetry path the right shape
The production-shaped database path uses PostgreSQL with TimescaleDB.
The migration promotes telemetry into a hypertable on timestamp, then adds indexes around the actual read patterns:
device + timestamp
timestamp
user + device
That is the part that makes this feel like a real telemetry backend instead of a chart demo.
The app needs to query by user, by device, and by time window. Those are the access patterns. The schema and indexes have to match them.

The storage model follows the read patterns: user ownership, device lookup, timestamp filtering, and aggregate queries.
There is a SQLite fallback for local development.
That is useful, but it creates a constraint: the aggregation logic has to work in both environments.
For PostgreSQL and TimescaleDB, the backend uses SQL window functions and time_bucket.
For SQLite, it falls back to Python-based integration and bucketing.
Same API shape. Different execution path.
That gives the project a practical dev-to-prod boundary:
SQLite for local work
PostgreSQL / TimescaleDB for production-shaped telemetry
Device ownership is part of every query
The API layer keeps the data scoped to the authenticated user.
Devices belong to users.
Telemetry queries join through devices and filter by user_id.
That prevents one user from querying another user’s device telemetry just by guessing a device ID.
The device API follows the same shape:
create device
→ attach to current user

get devices
→ return current user’s devices only

get telemetry
→ filter through current user’s devices
That matters because this is an energy portal shape. Home telemetry is personal operational data. The backend has to treat ownership as part of the query, not just a UI concern.
Dashboard analytics use canonical aggregate endpoints
The dashboard path uses aggregate endpoints for analytics.
The raw telemetry hook still exists, but it is explicitly marked as deprecated for dashboard analytics.
That is the right boundary.
Raw granular telemetry is useful for inspection and debugging. Dashboard analytics should use canonical aggregate endpoints so the UI, charts, and assistant all agree on the same calculation rules.
The frontend data path looks like this:
dashboard time range
→ user timezone
→ analytics hook
→ aggregate endpoint
→ top devices
→ hourly data
→ total kWh
→ chart sections
The AI receives summaries, not raw telemetry dumps
The AI path uses the same principle.
The assistant does not receive thousands of raw rows. The backend builds a telemetry context first.
That context includes:
- Today’s consumption
- Solar-related readings where device metadata supports it
- Estimated cost
- 7-day summary
- 30-day summary
- Current device matrix
- Live watts per device
- Grid import/export state
Then the model sees that compact context block.
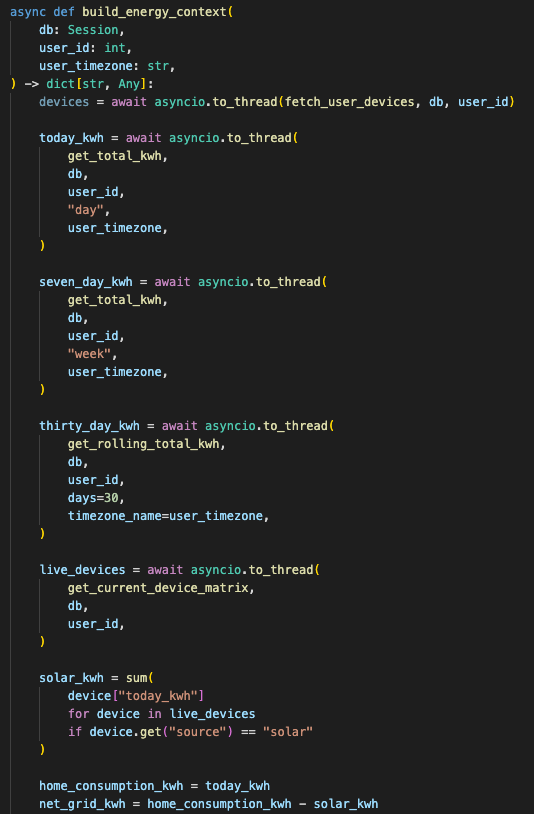
The backend computes and packages energy facts before the assistant explains them.
That design keeps the AI in the right role.
The database computes, the backend summarizes, and the model explains.
The service also moves heavier database work off the event loop with asyncio.to_thread.
That matters because the chat endpoint is async. Blocking SQL work inside the event loop can make unrelated requests feel slow. The code pushes the context-building work into a background thread so the async server has a better chance of staying responsive.
Routing happens before inference
The AI service has branch routing for different kinds of messages.
Energy questions route into the energy context path.
Cost and bill questions route into a financial-audit branch.
Action-like messages route into an action branch.
General conversation uses a fallback branch.
There is also a more explicit orchestrator layer in the codebase that classifies intent through deterministic keyword patterns instead of calling an LLM to decide which LLM to call.
That design direction is important.
An LLM router can become a billing loop if every routing decision costs tokens. For this kind of app, simple deterministic routing is usually enough:
energy words
→ energy path

cost words
→ financial path

turn / switch / set
→ action path

smalltalk
→ fast path
The current AI service uses a simpler branch detector, but the architecture direction is clear: route before inference, not with inference.
Actions are protocol output, not physical device control
The action protocol is intentionally narrow.
The assistant can output a strict JSON block only after explicit user consent:
{ "op": "SET_POWER", "device_name": "Target", "value": "OFF" }I’m treating that as an action-output protocol, not full physical device execution. The files show the format for controlled commands, but they do not show a real device-control adapter wired to smart hardware.
That distinction matters.
A safe assistant can suggest or emit a structured command.
A production smart home system needs another layer before execution:
- Device authorization
- Confirmation state
- Idempotency key
- Command log
- Rollback or undo path
- Hardware adapter
- Failure reporting
That is outside the current proof, so I’m not pretending it exists.
Cost controls sit before expensive inference
The cost controls are also part of the backend architecture.
Sentinel uses a Redis-backed cost monitor with:
- Global monthly spend cap
- Per-user daily token quota
- Per-user monthly token quota
- Usage counters
- Estimated cost tracking
- Memory fallback for local development
The app checks the financial store on startup. The AI API also checks rate limits before calling the service.
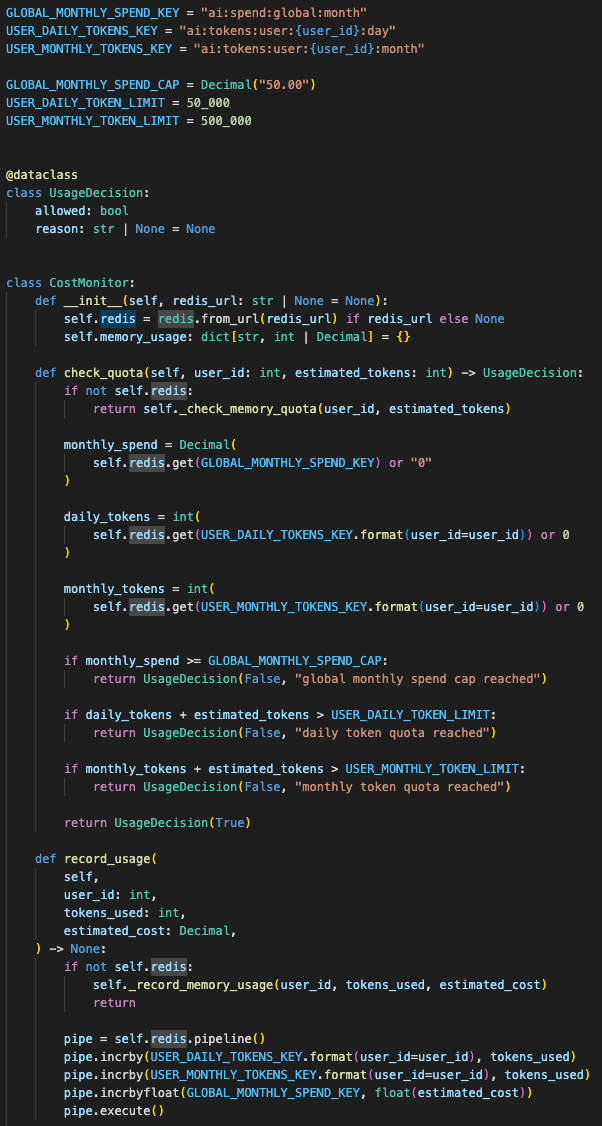
Shared counters protect deployed demos better than process-local memory when instances restart or scale.
This is not perfect billing infrastructure. It is demo protection.
For a public prototype, that still matters. One reload loop, curious user, or broken stream retry can drain an API key if the backend has no shared state. Redis gives the app a shared counter outside the server process.
That matters even more on platforms where instances restart or scale.
In-memory counters are fine locally.
Shared counters are the safer default for deployed demos.
Production config needs hard edges
The database layer also has production-shaped constraints.
For PostgreSQL, the engine uses:
- Connection pre-ping
- Pool sizing
- Overflow limit
- Pool timeout
- Connection recycle
- Statement timeout
- SSL mode
That is a practical deployment detail.
A telemetry dashboard can generate heavy aggregate queries. A bad query should not hold a database connection forever. The 30-second statement timeout gives the backend a hard ceiling.
The config layer also validates production hazards.
It warns on weak database passwords.
It rejects wildcard CORS origins in production.
It checks secret key length.
It caps AI request and daily quota values even if the environment is misconfigured.
That is the difference between “the app runs” and “the app has basic operational boundaries.”
Live updates have a first service boundary
The WebSocket layer is simpler.
It manages connected clients, subscriptions, unsubscriptions, pings, and broadcast by channel.
That gives the app a WebSocket foundation for live updates without forcing the dashboard to refetch everything manually.
The connection manager tracks:
- Active connections
- Channel subscriptions
- Client channels
- Broken connection cleanup
This is enough for the prototype shape. A larger production version would need authentication on the socket, backpressure handling, and probably a pub/sub layer if multiple backend instances are involved.
I would not call that finished distributed infrastructure yet.
I would call it the first clean service boundary.
The chat path streams and can be cancelled
The frontend chat path is also built around streaming.
When a user submits a message, the UI sends the last few messages, opens an SSE stream, renders the assistant bubble only after the first token arrives, and attaches backend metrics when the stream finishes.
It also supports cancellation through AbortController.
That matters because energy questions can trigger database context building and model inference. The user needs a way to stop the response without waiting for the whole stream to finish.
The stream parser buffers incomplete chunks across TCP frames.
Small detail, but it avoids broken JSON parsing when an SSE payload is split mid-message.
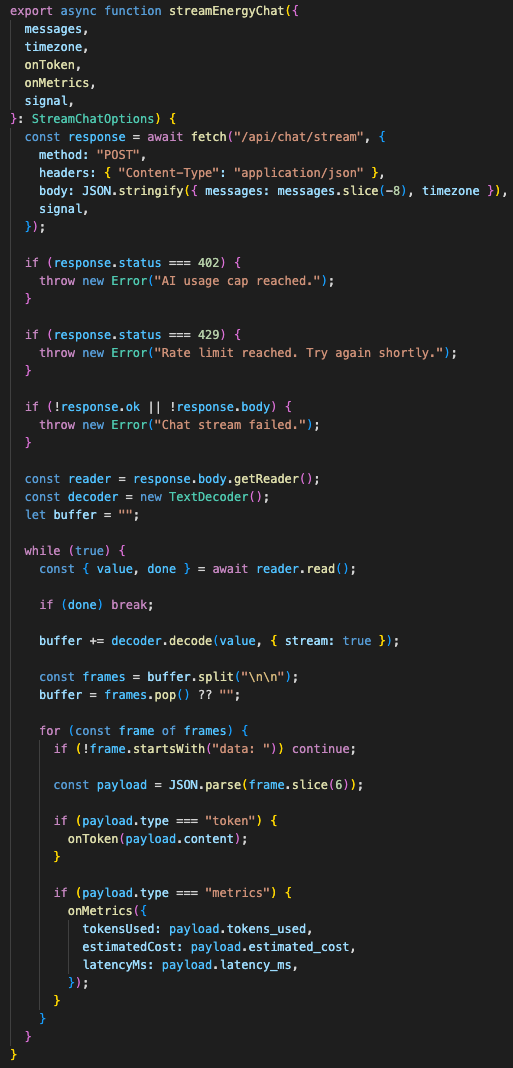
The client handles streaming chunks, cancellation, backend metrics, and quota errors without assuming every SSE payload arrives whole.
The value is in the backend handoff
This project could easily have become a pretty dashboard with an AI widget bolted onto it.
I wanted the backend to carry the value instead.
The useful architecture is the chain of constraints:
- Telemetry is scoped by user
- Raw readings are stored as time-series data
- Production-shaped storage uses TimescaleDB
- Energy is integrated server-side
- Large gaps are capped
- Calendar windows are timezone-aware
- Dashboard analytics use canonical aggregate endpoints
- AI receives bounded summaries
- Chat streams responses
- Cost limits sit before expensive inference
- Production config blocks unsafe defaults
That is the shape I trust more for smart home AI.
The model can explain the numbers.
It should not invent the numbers.
For an energy product, that boundary matters. A homeowner can tolerate a slightly plain answer. They should not tolerate a confident answer built from bad aggregation, wrong timezone windows, or raw telemetry shoved into a prompt because the backend avoided doing the math.
Sentinel is really about that handoff.
The database handles measurement.
The backend handles ownership, aggregation, limits, and context.
The AI handles explanation and interaction.
That is a much stronger foundation than treating the model like a spreadsheet, database, and device controller all at once.
Onto the next one. Let’s keep sharpening that edge!
First written on September 25, 2025.
Want to implement this architecture in your business?
Discuss Your Project