Securing the Data Behind the Dashboard: Flask, SQL, and Backend Boundaries
A dashboard looked like frontend work until the API started returning more data than the charts needed. The fix was making Flask the data boundary with scoped endpoints, aggregated responses, server-side filters, parameterized SQL, and no browser-side security assumptions.
I spent most of this week working on a data dashboard.
At first glance, dashboards look like frontend work: charts, tables, filters, and a few cards showing totals, trends, and activity.
But the more I built it, the more obvious the real problem became.
The dashboard was not the hard part.
The backend behind the dashboard was.
I’m getting deeper into data science and visualization nowadays so I wanted to understand how raw operational data becomes something a team can use without opening the whole database to the browser by accident.
A dashboard makes data look controlled because the screen looks controlled. But the screen is only the last layer. The backend decides what data leaves the system in the first place.
The project shape was simple:
database
→ backend API
→ filtered metrics
→ dashboard charts
→ user reads the result
The dashboard only looked simple because the backend was supposed to control what data left the database.
My first version worked. I had data in the database, Flask routes returning JSON, and charts rendering in the browser.
Then I checked the API responses more closely.
Some endpoints were returning more data than the dashboard needed, which is the issue.
If the chart only needs monthly totals, the API should not return raw customer-level records. If the dashboard only needs counts, the API should not expose full transaction rows. If one user only needs their own data, the backend should not rely on the frontend to hide the rest.

Sending raw records to the browser and hiding fields in the frontend made the dashboard a data leak waiting to happen.
The backend became the data boundary
So I changed the shape of the system.
The backend stopped being a pass-through layer. It became the data boundary.
The dashboard would not ask for raw tables. It would ask for specific views:
/sales-summary
/customer-activity
/monthly-volume
/top-categories
/error-rates
Each endpoint had one job: return only the data needed for that section of the dashboard.
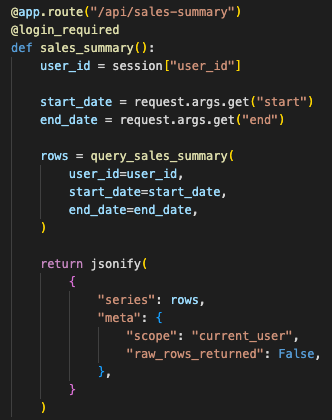
The route returned chart-ready metrics instead of dumping raw database rows into the browser.
The database layer mattered here. Raw operational tables kept the original records. Dashboard-facing queries produced controlled outputs: totals, grouped counts, filtered trends, and small slices of data that made sense for the UI.
Cleaner boundary:
raw database tables
→ backend query layer
→ sanitized response
→ dashboard visualization
Raw tables stayed server-side. The browser received only scoped, aggregated, chart-ready responses.
This is backend discipline. Main rule:
Do not send the browser data it does not need.
That rule changed how I wrote the API. Filtering happened before the response. Aggregation happened in the backend. User scope was checked before the query returned anything. The response shape was intentional, not just whatever came back from the table.
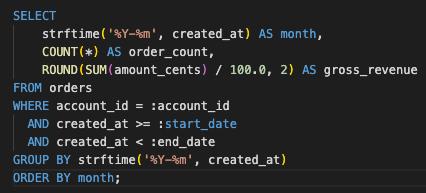
The query grouped and filtered data server-side, with user scope and date range applied before the response was created.
Deployment made the boundary real
Deployment made the risk clearer.
Local dashboards feel harmless because everything is on one machine. Once deployed, the endpoint is part of the application surface. If the route returns too much, the browser can see too much. If the query accepts loose parameters, the database is exposed through the filter UI.
So I kept the controls boring:
- authenticated routes
- server-side filters
- parameterized queries
- limited response shapes
- environment-based config
- no secrets in source code

Public dashboard requests passed through authentication, access checks, scoped queries, and limited response contracts.
The parameterized queries were important because dashboard filters are still user input.
Date ranges, search boxes, category filters, account IDs. They look harmless because they sit inside charts and dropdowns. To the backend, they are still outside input.
So the API could not build SQL by blindly joining strings. The query layer had to treat filters as untrusted.
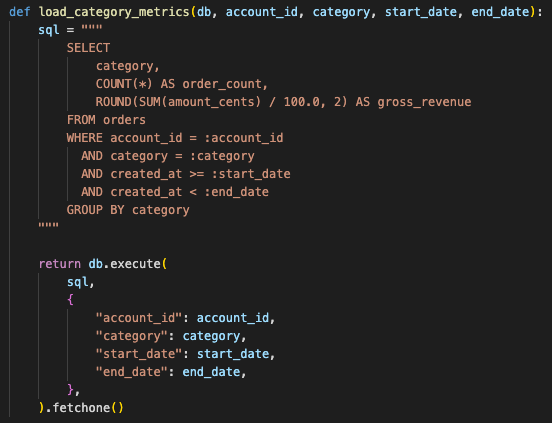
Dashboard filters were still user input, so the query layer used bound parameters instead of string-built SQL.
The chart was the last mile
This is where the dashboard stopped feeling like a small visualization task and became a backend system with a visual surface.
The chart is just the last mile. The actual work is deciding what data is allowed to leave the database.
Data visualization makes information readable, but it also widens the exposure surface if the backend is careless. People add filters. They drill down. They export. They search. Each feature is useful. Each one also creates another path to data.
So I kept the first version narrow:
- small number of endpoints
- explicit SQL queries
- aggregated responses
- server-side access checks
- no raw table dumps
- no browser-side security assumptions

Each dashboard widget mapped to a narrow backend endpoint with a clear data contract.
Result
As a result, the dashboard became easier to reason about. Each widget had a matching endpoint. Each endpoint had a clear data contract. Each query returned only what the UI needed.
If something looked wrong in the chart, I could trace it back to the query. If a user should not see something, the backend blocked it before the browser ever knew it existed.
A dashboard should help people make decisions. It should not become a side door into the database.
This build reminded me that backend work is mostly boundary work:
- between raw data and usable data
- between internal records and client-visible metrics
- between a harmless filter and an unsafe query
- between “it works locally” and “it is safe enough to deploy”
Data visualization made the work visible.
The backend made it safe to use.
Onto the next one. Let’s keep sharpening that edge.
First written on February 18, 2019.
Want to implement this architecture in your business?
Discuss Your Project